
Introduction
Equations to a straight line are fundamental mathematical tools used to describe and analyse linear relationships between variables. They provide insights into the slope, intercept, and other properties of a line, enabling us to make predictions, solve problems, and understand the relationships between quantities. In this article, we will explore the concept of equations to a straight line, explain their components, and highlight their practical applications in various fields.
Slope-Intercept Form
The slope-intercept form of a linear equation is commonly used to express a straight line. It is represented as y = mx + b, where ‘m’ represents the slope and ‘b’ represents the y-intercept. The slope (m) defines the steepness or inclination of the line, while the y-intercept (b) represents the point where the line intersects the y-axis.
Components of the Equation
a) Slope (m): The slope of a line determines the ratio of vertical change (rise) to horizontal change (run) between any two points on the line. It measures the rate at which the dependent variable (y) changes with respect to the independent variable (x). A positive slope indicates an upward trend, while a negative slope represents a downward trend.
b) Y-Intercept (b): The y-intercept is the value of y when x equals zero. It represents the starting point of the line on the y-axis. The y-intercept provides insights into the initial condition or value of the dependent variable.
Applications of Equations to a Straight Line
a) Linear Regression: Equations to a straight line are widely used in statistics and data analysis for linear regression. By fitting a line to a set of data points, we can estimate the relationship between variables, predict future values, and assess the strength of the correlation.
b) Engineering and Physics: Straight lines are frequently encountered in engineering and physics. Equations to a straight line are used to model relationships in fields such as mechanics, electrical circuits, fluid dynamics, and more. These equations enable engineers and scientists to analyse and predict the behaviour of systems and phenomena.
c) Economics and Finance: Equations to a straight line play a crucial role in economic and financial analysis. They are used to represent supply and demand curves, cost functions, revenue functions, and other economic relationships. These equations assist in determining optimal pricing strategies, evaluating market trends, and making informed business decisions.
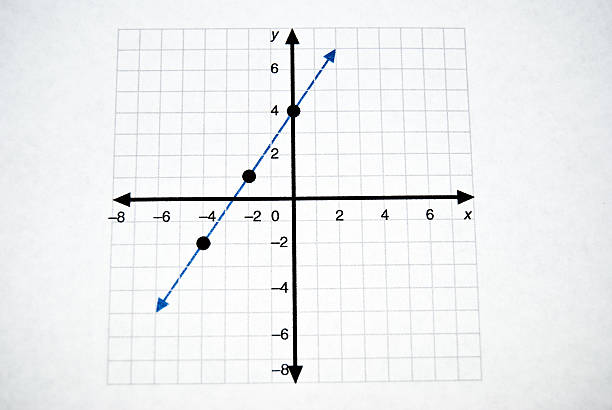
d) Graphical Representation: Equations to a straight line can be graphically represented, providing a visual understanding of the relationship between variables. Graphs allow us to observe trends, identify patterns, and interpret the behaviour of the line in a more intuitive manner.
Conclusion
Equations to a straight line provide a concise and powerful method for describing linear relationships between variables. By understanding the slope, intercept, and graphical representation, we gain valuable insights into the behaviour and trends of these relationships. Equations to a straight line find applications in various fields, from statistical analysis and engineering to economics and finance. Embracing the concept of equations to a straight line equips us with a versatile tool for analysing data, predicting outcomes, and understanding the fundamental relationships between quantities.