Reading wave graphs
FREE PHYSICS REVISION · UNIT 3 · A1.1.2
Pearson BTEC Level 3 AAQ Applied Science · Issue 7 (May 2026)
Learning objectives
- Distinguish displacement–distance graphs from displacement–time graphs by interpreting their axes.
- Determine amplitude and wavelength from a spatial wave graph using its scale.
- Determine period from a temporal wave graph and calculate the corresponding frequency.
- Explain why a spatial snapshot cannot, by itself, determine a wave’s period or propagation speed.
Specification mapping: A1.1.2
Prerequisites: A1.1.1
Physical principles
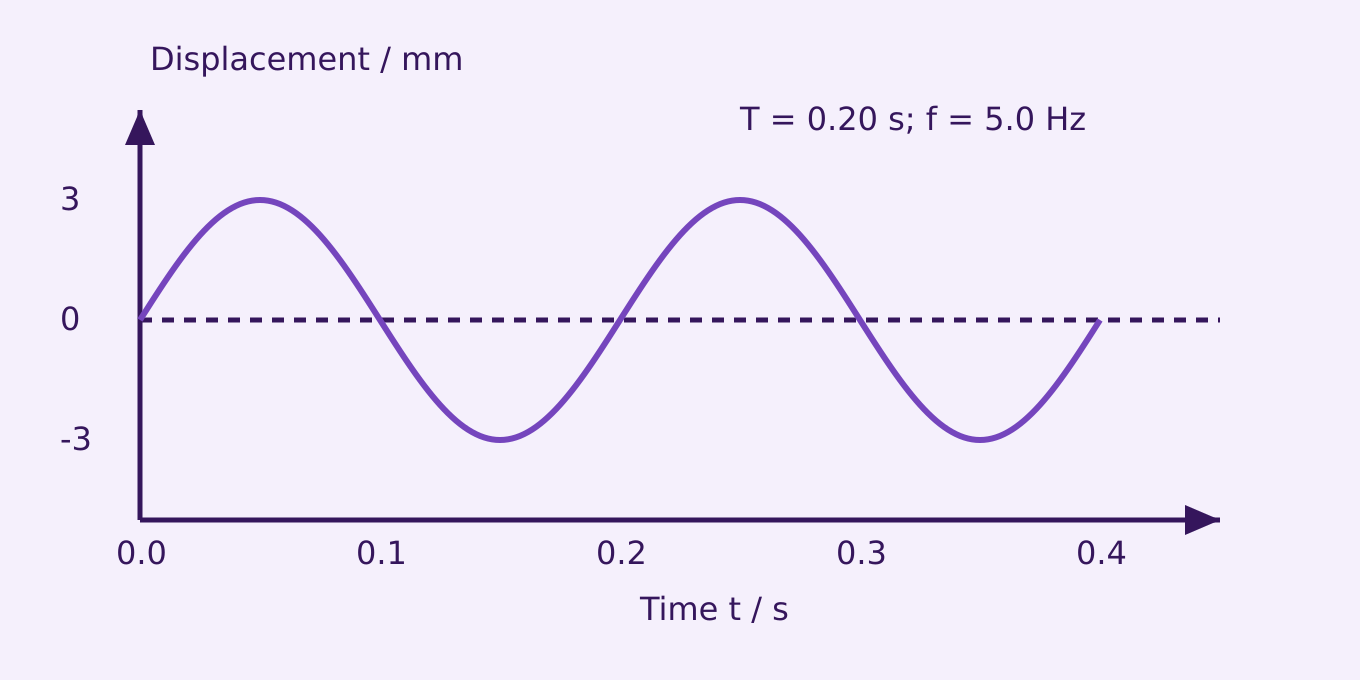
A displacement–distance graph is a snapshot at one time. Its horizontal axis is position in metres and the separation of adjacent crests is wavelength. A displacement–time graph follows one location as time passes. Its horizontal axis is time in seconds and the separation of adjacent crests is period.
Check both axis labels before extracting a number. Identical-looking curves can represent different measurements. A crest and the next zero crossing are separated by a quarter cycle, not a full cycle. Points with equal displacement need not have the same phase: one may be moving upwards while the other is moving downwards.
Use the zero-displacement line to find amplitude, including when a graph has a non-zero plotting baseline. Read several complete repeats and divide by their number when this improves precision. The slope of a displacement–time curve describes particle velocity; it is not the propagation speed of the wave.
Scientific diagram and interpretation
Worked examples and applications
Spatial reading
A snapshot shows crests at x = 0.20 m and 0.80 m. λ = 0.80 − 0.20 = 0.60 m. If five intervals span 3.0 m, the same λ follows from 3.0/5.
Temporal reading
At one point, successive crests occur at 0.10 s and 0.35 s. T = 0.25 s and f = 1/0.25 = 4.0 Hz. You cannot read wavelength from this time axis alone.
Common misconceptions
A time axis does not give wavelength. Equal displacements do not establish equal phase.
Examination technique
Annotate the interval between equivalent points and show subtraction of axis readings.
For an explanation, connect the physical cause to its effect. For a calculation, state the model, rearrange before substitution, retain intermediate digits, and finish with units. For a data question, refer to the actual readings and distinguish a trend from proof of a cause.
Check your understanding
Five questions. Choose an option, then Check Answer. Read the feedback and use Try Again to reset. Use Tab between controls, arrow keys within radio groups, and Enter or Space on buttons. These local practice answers are not saved.
Take Your Learning Further
Practise
Build Your Confidence
Reinforce your understanding with our topic-based workbook. Every workbook page links back to its matching online lesson, so you can revisit explanations whenever you need support.
Explore Workbook – PhysicsMaster
Get Exam Ready
Apply your knowledge with exam-style practice papers and detailed mark schemes. Identify what you’ve mastered and what to revise next.
Practice Papers – PhysicsEXAM RESOURCES
Physics exam resources
Apply your knowledge with written practice.
Browse exam resources