Displacement–time graphs and velocity
FREE PHYSICS REVISION · UNIT 3 · B1.3.3
Pearson BTEC Level 3 AAQ Applied Science · Issue 7 (May 2026)
Learning objectives
- Interpret positive, negative and zero gradients on a displacement–time graph.
- Calculate velocity from the gradient of a straight displacement–time segment.
- Determine instantaneous velocity from the gradient of a tangent to a curved graph.
- Explain how the shape of a displacement–time graph distinguishes constant velocity from changing velocity.
Specification mapping: B1.3.3
Prerequisites: B1.3
Physical principles
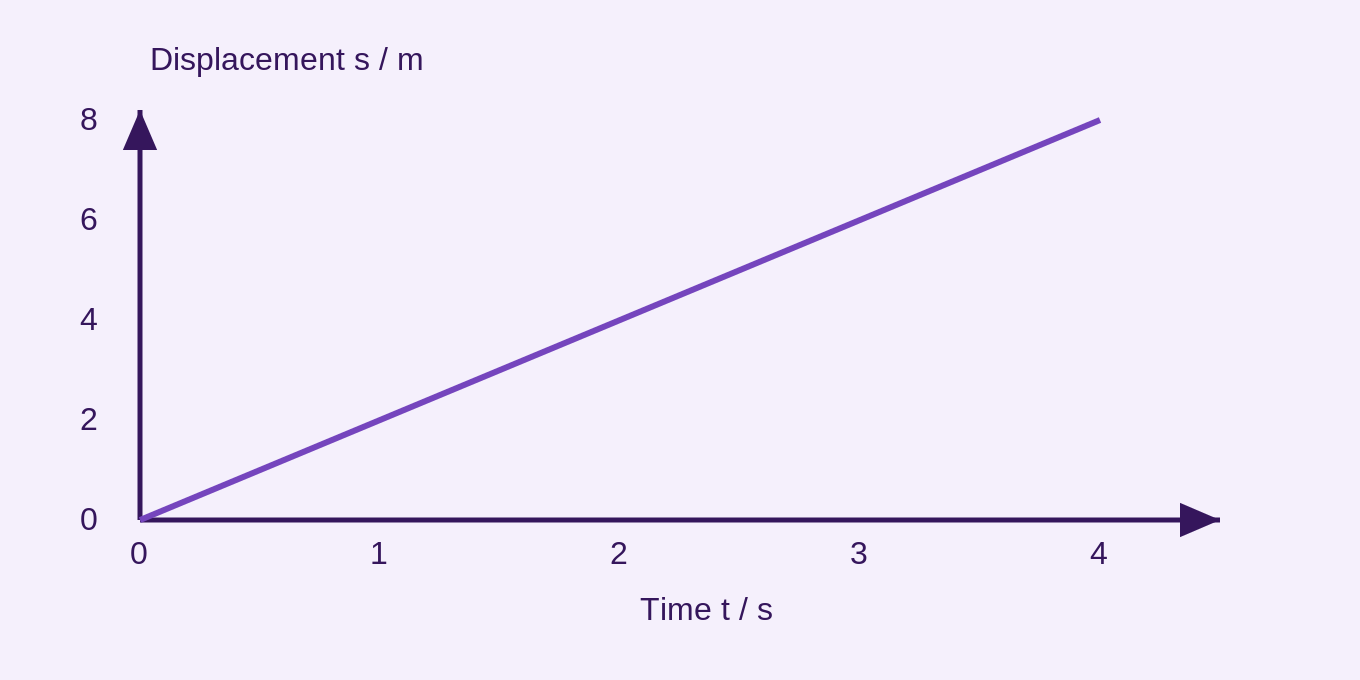
The gradient of a displacement–time graph is velocity: Δs/Δt for a straight segment. A positive gradient means motion in the positive direction; a negative gradient means motion in the opposite direction. A horizontal segment means constant displacement and hence zero velocity.
On a curved graph, the instantaneous velocity is the gradient of the tangent at the required time. Choose two well-separated points on the tangent, not necessarily measured data points, and calculate rise divided by run. The average velocity between two times is the gradient of their connecting chord, which can differ from the tangent gradient.
A steeper magnitude of gradient corresponds to greater speed. The graph’s height gives position relative to the origin, not velocity. An object can be far from the origin and stationary or pass through the origin at a large speed. Displacement–time area has units m s and does not directly give distance travelled.
Scientific diagram and interpretation
Equations and relationships
v = Δs/Δt (gradient)
Worked examples and applications
Straight-segment velocity
Displacement changes from 4.0 m at 1.0 s to 16 m at 5.0 s. v = (16 − 4.0)/(5.0 − 1.0) = 3.0 m s⁻¹.
Tangent estimate
A tangent passes through (2.0 s, 5.0 m) and (6.0 s, 17 m). Its slope is 12/4.0 = 3.0 m s⁻¹. Use the tangent points even if the curve itself does not pass through them.
Common misconceptions
The displacement value is not the velocity; velocity comes from slope.
Examination technique
Draw a large gradient triangle and include units on both changes.
For an explanation, connect the physical cause to its effect. For a calculation, state the model, rearrange before substitution, retain intermediate digits, and finish with units. For a data question, refer to the actual readings and distinguish a trend from proof of a cause.
Check your understanding
Five questions. Choose an option, then Check Answer. Read the feedback and use Try Again to reset. Use Tab between controls, arrow keys within radio groups, and Enter or Space on buttons. These local practice answers are not saved.
Take Your Learning Further
Practise
Build Your Confidence
Reinforce your understanding with our topic-based workbook. Every workbook page links back to its matching online lesson, so you can revisit explanations whenever you need support.
Explore Workbook – PhysicsMaster
Get Exam Ready
Apply your knowledge with exam-style practice papers and detailed mark schemes. Identify what you’ve mastered and what to revise next.
Practice Papers – PhysicsEXAM RESOURCES
Physics exam resources
Apply your knowledge with written practice.
Browse exam resources