FREE PHYSICS REVISION · UNIT 3 · B1.3.7
Pearson BTEC Level 3 AAQ Applied Science · Issue 7 (May 2026)
What you will learn
Ramp investigations using light gates, video or position measurements; control and uncertainty.
Specification mapping: B1.3.7
Prerequisites: B1.3.6
Physical principles
A trolley descending a ramp can accelerate because gravity has a component along the slope. Friction, rolling resistance and air resistance oppose motion. The measured acceleration need not equal g or be perfectly constant. Fix the ramp securely, prevent the trolley falling off and use a safe catcher; keep hands clear of moving equipment.
Two light gates can measure local speeds using an interrupt card of known length: v ≈ card length / blocking time. Record the elapsed time between the speed measurements, then estimate average acceleration (v₂ − v₁)/Δt. Assign each speed to the appropriate central time during the blockage; a long card on a rapidly accelerating trolley reduces locality.
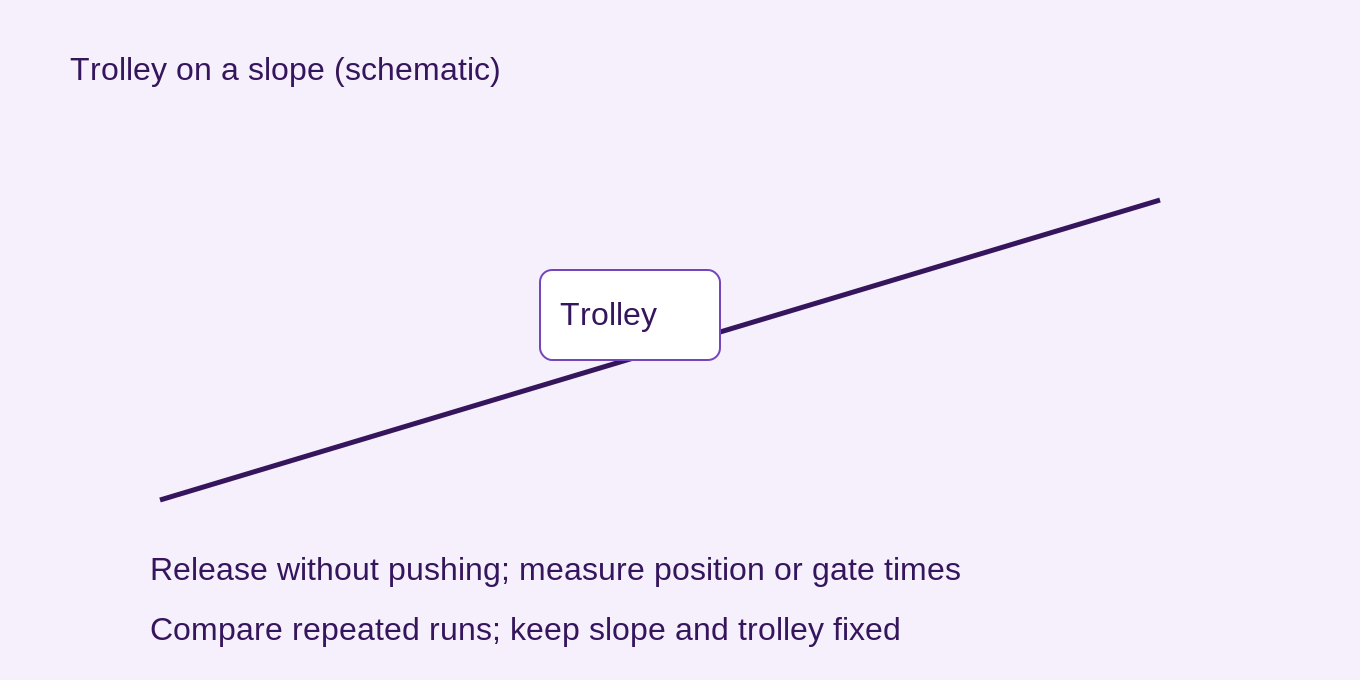
Alternatively track position against time with calibrated video, derive velocities over intervals and plot velocity against time. The gradient estimates acceleration. Control slope angle, trolley, release point and release method; do not add a push. Repeat trials, quote spread, and distinguish random timing scatter from systematic length calibration or alignment error.
Comparing different ramp angles tests how the driving component changes. If acceleration varies along the ramp, report that evidence rather than forcing a straight-line model. A best-fit slope over many velocity readings is generally more robust than subtracting two noisy speeds.
Scientific diagram and interpretation
Worked examples and applications
Light-gate calculation
A 0.050 m card blocks gate 1 for 0.100 s and gate 2 for 0.050 s. Speeds are 0.50 and 1.0 m s⁻¹. If their assigned times differ by 0.80 s, a = (1.0−0.50)/0.80 = 0.625 m s⁻² ≈ 0.63 m s⁻².
Repeatability
Three accelerations are 0.61, 0.64 and 0.63 m s⁻². Mean = 1.88/3 = 0.627 m s⁻² ≈ 0.63. Repetition reduces random uncertainty in the mean but not a shared mismeasured card length.
Common misconceptions
The time to block one gate is not the time interval between the two velocity measurements.
Examination technique
Explain what is measured directly, how velocity is derived and which graph gradient gives acceleration.
For an explanation, connect the physical cause to its effect. For a calculation, state the model, rearrange before substitution, retain intermediate digits, and finish with units. For a data question, refer to the actual readings and distinguish a trend from proof of a cause.
Check your understanding
Five questions. Choose an option, then Check Answer. Read the feedback and use Try Again to reset. Use Tab between controls, arrow keys within radio groups, and Enter or Space on buttons. These local practice answers are not saved.

FREE RESOURCES
Physics revision
Explore the available lessons, diagrams and questions in your subject hub.
Free No payment
Explore Physics Browse exam resources