FREE PHYSICS REVISION · UNIT 3 · A1.3.3
Pearson BTEC Level 3 AAQ Applied Science · Issue 7 (May 2026)
What you will learn
Use spectral line patterns to identify elements and mixtures in gases.
Specification mapping: A1.3.3
Prerequisites: A1.3.1, A1.3.2
Physical principles
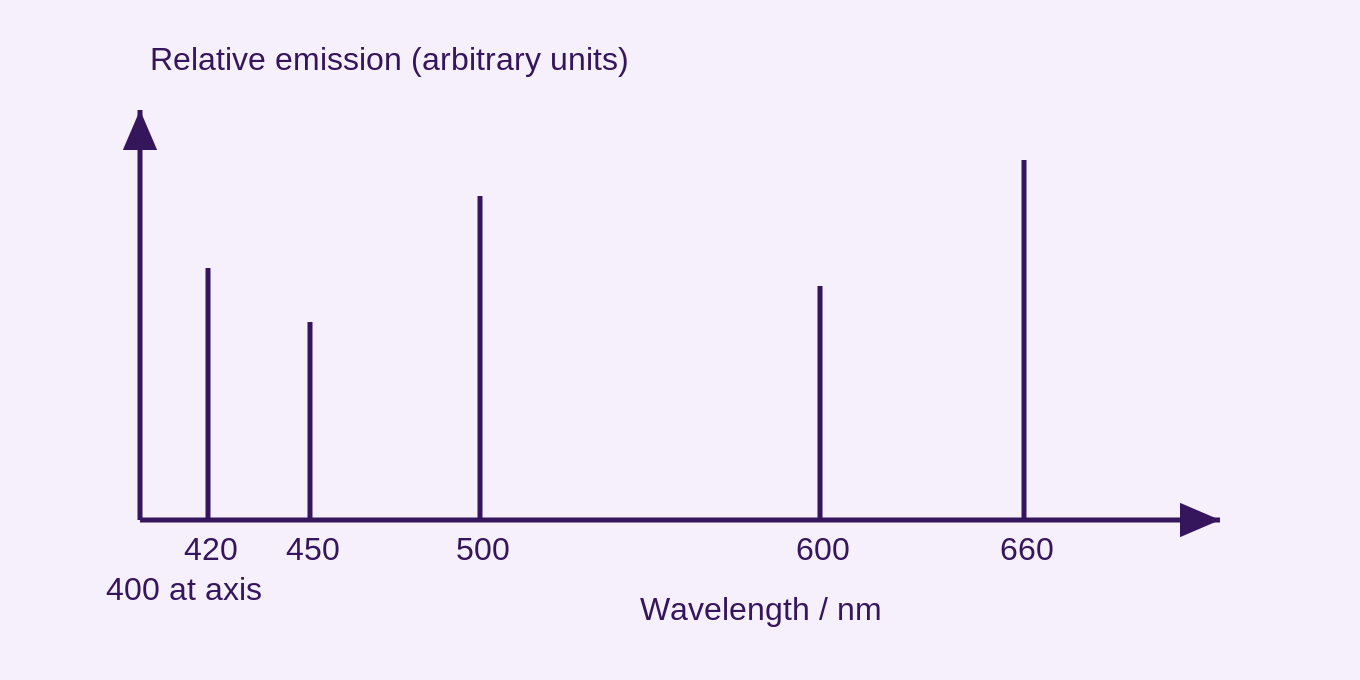
An element has a characteristic set of allowed atomic energy differences and hence a characteristic pattern of emission lines. Compare measured wavelengths or calibrated line positions with reference spectra. Several matching lines provide stronger evidence than a single colour, because distinct elements can have nearby lines.
In a gas mixture, lines from more than one element may appear. Identify each candidate by a consistent group of positions. Line intensity depends on abundance, excitation conditions, instrument response and transition probabilities; it is not a simple direct measure of concentration without calibration. An absent weak line may be below the instrument’s detection threshold.
A sensible method calibrates wavelength against a known source, checks resolution, records uncertainties and compares line separations. If two reference wavelengths differ by less than the resolution, the instrument may show one unresolved feature. A spectrum can support identification without proving that no other element is present.
Scientific diagram and interpretation
Worked examples and applications
Match a pattern
Illustrative references: gas X has lines at 420, 500 and 660 nm; gas Y at 450 and 600 nm. An unknown has 420, 450, 500, 600 and 660 nm. Both X and Y are supported by the complete set of matches.
Check resolution
An instrument resolves lines separated by at least 2.0 nm. Lines at 589.0 and 589.6 nm differ by 0.6 nm, so they are not resolved by this instrument. A single observed peak does not prove a single transition.
Common misconceptions
One shared line or the overall glow colour does not uniquely identify every component of a mixture.
Examination technique
Quote the actual matching wavelengths and discuss uncertainty or unmatched lines.
For an explanation, connect the physical cause to its effect. For a calculation, state the model, rearrange before substitution, retain intermediate digits, and finish with units. For a data question, refer to the actual readings and distinguish a trend from proof of a cause.
Check your understanding
Five questions. Choose an option, then Check Answer. Read the feedback and use Try Again to reset. Use Tab between controls, arrow keys within radio groups, and Enter or Space on buttons. These local practice answers are not saved.
FREE RESOURCES
Physics revision
Explore the available lessons, diagrams and questions in your subject hub.
Free No payment
Explore Physics Browse exam resources